
The US Dollar was on the rise yesterday and opened with a positive gap during today’s Asian session against a number of its counterparts as market worries for the possible side effects of the war in Ukraine are still high. It’s characteristic that gold prices were also on the rise reaching the key mark of $2000 per ounce supported by safe haven inflows, before correcting a bit lower during today’s Asian session. The war in Ukraine is ongoing with no signs of a possible ceasefire on the horizon yet and Russian negotiators said they did not have positive developments to report following talks with Ukraine, according to Reuters. US stockmarkets were in the reds yesterday as markets tended to worry about the possibility of a recession coming as a result of oil prices surging.
Also, the prospect of a tight monetary policy from the Fed in combination with inflation being high could spur the possibility of stagflation, being low growth rates in combination with high inflation rates seems to have increased possibilities. Analysts tend to highlight the possibility of a stock market sell off in the next few days should the market’s nerves not calm down yet for the time being no panic seems to be present yet. Given the lack of high impact financial releases today we expect fundamentals to take over the lead and guide the market’s reactions, especially regarding the war in Ukraine and the level of oil prices.
Dow Jones dropped yesterday breaking the 33290 (R1) support line, now turned to resistance. We tend to maintain a bearish outlook for the index as long as it remains below the downward trendline incepted since the 3rd of March. Also please note that the RSI indicator below our 4-hour chart is nearing the reading of 30, also implying that the bears have the advantage.
Should the bears actually maintain control over the index, we may see Dow Jones, breaking the 32250 (S1) support line that held its ground on the 24th of February and aim for the 31600 (S2) level. Should the bulls take over, we may see the index breaking the prementioned downward trendline, the 33290 (R1) resistance line and aim for the 34290 (R2) level.
All eyes on oil and natural gas prices
Oil prices corrected lower yesterday retreating from the highs of $125 per barrel yet during the late American and today’s Asian session seem to regain traction as they move upwards. The prospect of cutting of Russia from the global oil market seems to have spooked investors and the US seems willing to press ahead with banning the import of oil products from Russia unilaterally. On the other hand, Germany’s Chancellor Olaf Scholz pushed back against the idea of banning oil imports from Russia despite pressure being exercised by Washington and Kyiv, as he stated that Europe’s energy supplies cannot be secured without Russian imports. On the other hand, Russia’s energy minister Alexander Novak threatened to cut natural gas supplies to Europe via the Nord Stream 1 pipeline as part of its response to sanctions imposed over the invasion of Ukraine.
Overall, the situation becomes critical for Europe’s recovery while OPEC members seem to show little willingness to increase production levels and it was characteristic that sources within the oil producing group have reportedly stated that OPEC policies had nothing to do with the surge in oil prices. Oil traders are expected to be moved by fundamentals today yet may keep also an eye out for the release of the US weekly API stock figure. WTI’s price dropped yesterday yet bounced on the 115.00 (S1) support line and is now testing the 119.00 (R1) resistance level. Given that the RSI indicator below our 4-hour chart is nearing the reading of 70, we expect the commodity’s price to have further advances. Should the buying interest remain present we may see WTI’s price breaking the 119.00 (R1) resistance line and aim for the 125.00 (R2) resistance level. Should sellers take over, we may se the commodity’s price reversing course breaking the 115.00 (S1) support line and aim for the 110.00 (S2) level.
Other highlights for today
Today in the European session we get Norway’s GDP rates for January, Germany’s industrial output for January as well and Eurozone’s revised GDP Rate, while in the American session we get Canada’s trade data and later on the US weekly API crude oil inventories figure. During Wednesday’s Asian session, we get Japan’s GDP rate for Q4, and China’s inflation metrics for February, while RBA Governor Lowe speaks.
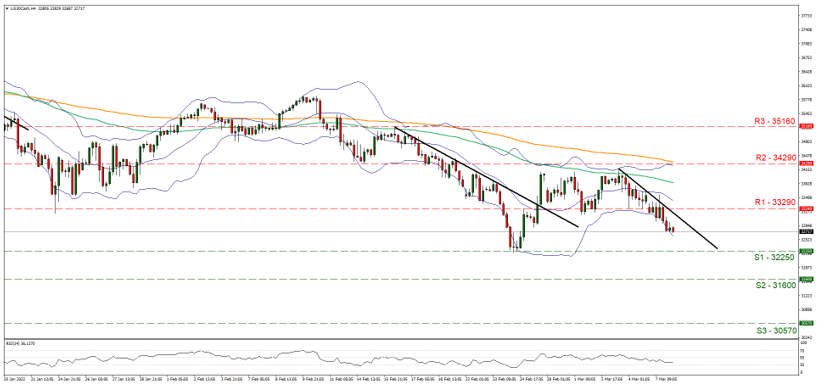
Support: 32250 (S1), 31600 (S2), 30570 (S3)
Resistance: 33290 (R1), 34290 (R2), 35160 (R3)
WTI H4 Chart

Support: 115.00 (S1), 110.00 (S2), 105.00 (S3)
Resistance: 119.00 (R1), 125.00 (R2), 130.00 (R3)


If you have any general queries or comments relating to this article please send an email directly to our Research team at research_team@ironfx.com
إخلاء المسؤولية:
لا تُعد هذه المعلومات نصيحة استثمارية أو توصية بالاستثمار، وإنما تُعد تواصلاً تسويقيًا. لا تتحمل IronFX أي مسؤولية عن أي بيانات أو معلومات مقدمة من أطراف ثالثة تم الإشارة إليها أو الارتباط بها في هذا التواصل.


