

WTI’s price over the past week and since our last report, was on the rise and stabilised. On a fundamental level we are to have a look at the state of the US oil market as well as factors and issues affecting the demand and supply sides of the international oil market. The report is to be concluded with a technical analysis of WTI’s daily chart for a rounder view.
US Oil market tightens
We make a start by examining the data on the ground of the US oil market. Last Friday Baker Hughes reported an increase of active oil rigs in the US in a signal of potentially increased oil demand pressuring oil producers in activating more wells, thus the rise of the number of active oil rigs in the US is interpreted as a bullish signal for oil prices.
The signals intensified as API reported on Tuesday a drawdown in US crude oil inventories of -3.420 million barrels implying that oil production levels surpassed aggregated oil demand in the US. The bullish signal was further enhanced as EIA the following day reported a substantial drawdown in US crude oil inventories of -9.285 million barrels in a clear signal of a tightening of the US oil market. It should be noted though that oil imports dropped into the negatives while exports were on the rise potentially fuelling the drop of US oil inventories.
Also the rise of the Distillates Stocks by 4.046 million barrels tends to set some question marks in regards to the tightness of the US oil market. In any case, should we see the US oil market remaining tight or even tightening even further in the coming week we may see oil prices getting some support.
The US economy and the Fed effect
On the demand side we have to note that economic activity in the manufacturing sector was on the decline creating worries for US oil demand. The drop of the ISM manufacturing PMI figure for August and the anemic growth of the industrial production growth rate for the same month were characteristic.
Yet the Fed decided yesterday to cut rates by 25 basis points as was widely expected and its policymakers signalled that two more rate cuts until the end of the year are on the way. The release practically signalled an easing of financial condition in the US economy which in turn could increase economic activity and thus support oil demand to grow.
It’s characteristic that Kuwait’s Oil Minister Tariq Al-Roumi said on Thursday he anticipated higher oil demand following the recent US interest rate cut, particularly from Asian markets. In any case we also note the possible delay of the positive effect the Fed’s rate cut may have on oil demand and it remains to be seen whether the easing of the Fed’s monetary policy will actually help oil demand to rise.
US sanctions on Russia and the war in Ukraine
Also a recurring issue that arose over the past weekend was the call of US President Trump to impose more sanctions on Russian oil. The US President stated that he was “ready to do major sanctions on Russia” once Nato nations had “agreed, and started, to do the same thing”.
The spot light is now on Europe as should they go along we may see the noose tightening further on Russian oil supply which may add more bullish pressure on oil prices. Also the recent Ukrainian drone attack on Russian oil facilities reveals the Ukrainian plans to hit Russian oil infrastructure in order to increase the financial pressure on the Russian war machine.
Russia’s oil pipeline monopoly Transneft has warned producers they may have to cut output following Ukraine’s drone attacks on critical export ports and refineries, as reported by Reuters. Should we see the attacks on Russian oil facilities, including pipelines and refineries intensifying we may see oil prices getting further support.
Oil Technical Analysis
WTI Cash Daily Chart
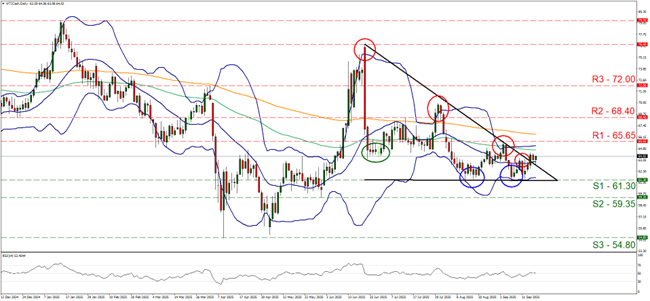
- Support: 61.30 (S1), 59.35 (S2), 54.80 (S3)
- Resistance: 65.65 (R1), 68.40 (R2), 72.00 (R3)
WTI’s price action over the past week bounced on the 61.30 (S1) support line and stabilised in the midst of the 65.65 (R1) resistance line and the S1. Given that the commodity’s price action broke the downward trendline guiding it since the 23rd of June, thus escaping the bounds of the descending triangle limiting it to the side.
Given that the prementioned downward trendline has been broken signalling an interruption of the downward motion we switch our bearish outlook in favour of a sideways motion bias.
Also supporting our sideways motion bias is supported by the RSI indicator that is currently running along the reading of 50, implying an indecisiveness on behalf of market participants for the direction of the commodity’s price.
For a bullish outlook to emerge we would require WTI’s price to break the 65.65 (R1) resistance line and start aiming for the 68.40 (R2) resistance level. Should the bears take over, we may see WTI’s price dropping below the 61.30 (S1) support line and start aiming if note breaking also the 59.35 (S2) support base.
إخلاء المسؤولية:
This information is not considered investment advice or an investment recommendation, but instead a marketing communication. IronFX is not responsible for any data or information provided by third parties referenced or hyperlinked in this communication.


