


On a fundamental level in todays’ report we are to have a look at the recent IEA report, OPEC+’s meeting over the week, the pressure on the EU to impose tariffs on China and India and end the report with the state of the US oil market. The report is to be concluded with a technical analysis of WTI’s daily chart for a rounder view.
IEA Monthly report and China’s role
The IEA’s monthly report for September was released earlier on today. The IEA states that world wti demand is forecasted to rise by 740 kb/d y-o-y in 2025, which is slightly higher than the figure presented in their previous report and that global wti supply increased in August to a record 106 mb/d. The IEA notes that “China continues to stockpile crude oil, helping keep Brent crude futures in slight backwardation” and thus should China continue to stockpile crude oil it could potentially aid Crude oil prices.
Moreover, it has been reported by Bloomberg that the Chinese Government is considering asking state lenders to lend to local authorities in order for the local authorities to make payments towards private companies.
In turn the possible payment of unpaid bills could boost spending by private companies within the Chinese economy, which may be translated indirectly into a continued demand for oil. However, in the same report the IEA noted that the global oil output may rise more than expected as OPEC+ continues to unwind their oil production cuts. Overall, the increase in supply may have bearish implications for oil’s price.
OPEC+ agrees to increase oil production
Continuing from our above paragraph, OPEC+ met over the weekend to discuss the oil cartels production levels. The group agreed to further raise oil production from October as Saudi Arabia seeks to regain lost market share with the group agreeing to increase production by 137k bpd, which in theory may have been bearish for oil prices as supply continues to rise.
Yet, when compared to the previous agreed increases of 555,000 bpd for September and August and 411k bpd for the months of June and July, the increase of 137k may have been lower than what market participants had anticipated and could have thus resulted in some upwards pressures for wti prices.
Nonetheless, should OPEC+ continue on their path to unwind oil production cuts it may increase the overall supply of wti into the markets and could continue to weigh on wti prices. Lastly, their next meeting is set to occur on the 5th of October and may garner the market’s attention once again.
EU to take on China and India?
US President Donald Trump has urged the EU to impose tariffs on India and China in attempt to curb the flow of Russian wti into the global markets. According to a report by Reuters, “Officials said Trump urged the EU to hit India و China with up to 100% tariffs in order to put pressure on Russian President Vladimir Putin”, essentially trying influence China and India to reduce their purchases of Russian wti. In turn the possible exertion of tariffs could exert economic pressure yet considering the size of India’s and China’s economy, we see such a scenario as unlikely to occur.
Especially considering that the EU is attempting to finalize a trade deal with India and thus any “hostile” actions could derail such an agreement. Nevertheless, any attempt to curb Russian wti exports could lead to worries about a possible oil supply constraint and could aid oil prices.
Is the US oil market easing again?
On a more localised view we note that the US oil market seems to be showing some signs of easing. Yet this past Friday Baker Hughes announced another increase of active oil rigs in the US this time by one, increasing the number of active oil rigs from 412 to 414. The increase of active oil rigs in the US may be signalling an increase in demand in the US oil market which forces oil producers to reactivate shut in wells, thus it could be considered as a bullish sign for oil prices and a tightening signal for the US oil market.
However, on Wednesday the API reported an increase of US oil inventories by 1.250 million barrels. Moreover, the EIA weekly crude oil inventories figure also showcased an increase in US oil inventories by reporting an increase of 3.393 million barrels which may have taken market participants by surprise as the figure was expected to showcase a drawdown of 1.9 million barrels.
Nevertheless, the figures highlight how US production levels may have overcome aggregated oil demand in the US economy thus allowing for an increase in US oil inventories. In turn the possibility of supply exceeding demand in the US oil market, may have weighed on oil prices.
Oil Technical Analysis
WTI Cash Daily Chart
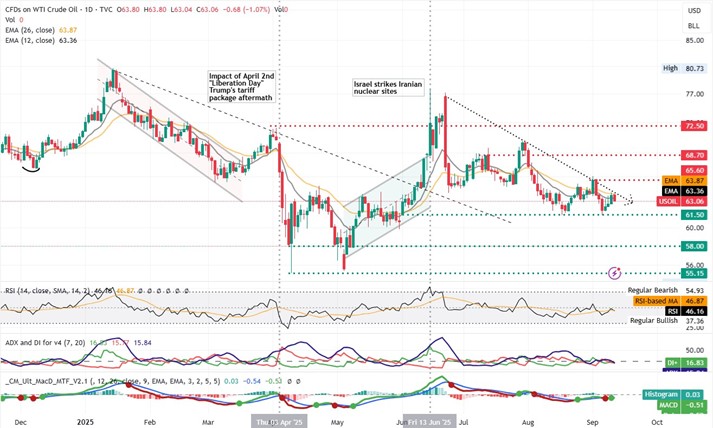
- Support: 61.75 (S1), 58.65 (S2), 55.25 (S3)
- Resistance: 64.50 (R1), 68.10 (R2), 71.60 (R3)
WTI’s price appears to be moving in a sideways fashion. We opt for a sideways bias for the commodity’s price and supporting our case is the RSI indicator below our chart which currently registers a figure near 50 implying a neutral market sentiment. For our sideways bias to be maintained we would require the commodity’s price to remain confined between the 61.75 (S1) support level and the 64.50 (R1) resistance line.
On the other hand for a bullish outlook we would require a clear break above the 64.50 (R1) resistance level with the next possible target for the bulls being the 68.10 (R2) resistance line. Lastly, for a bearish outlook we would require a clear break below our 61.75 (S1) support level with the next possible target for the bears being the 58.65 (S2) support line.
إخلاء المسؤولية:
This information is not considered investment advice or an investment recommendation, but instead a marketing communication. IronFX is not responsible for any data or information provided by third parties referenced or hyperlinked in this communication.


